ISCInstrumentation & Signal Conditioning
LOMI Thermal Control Modification for Enhanced Composting
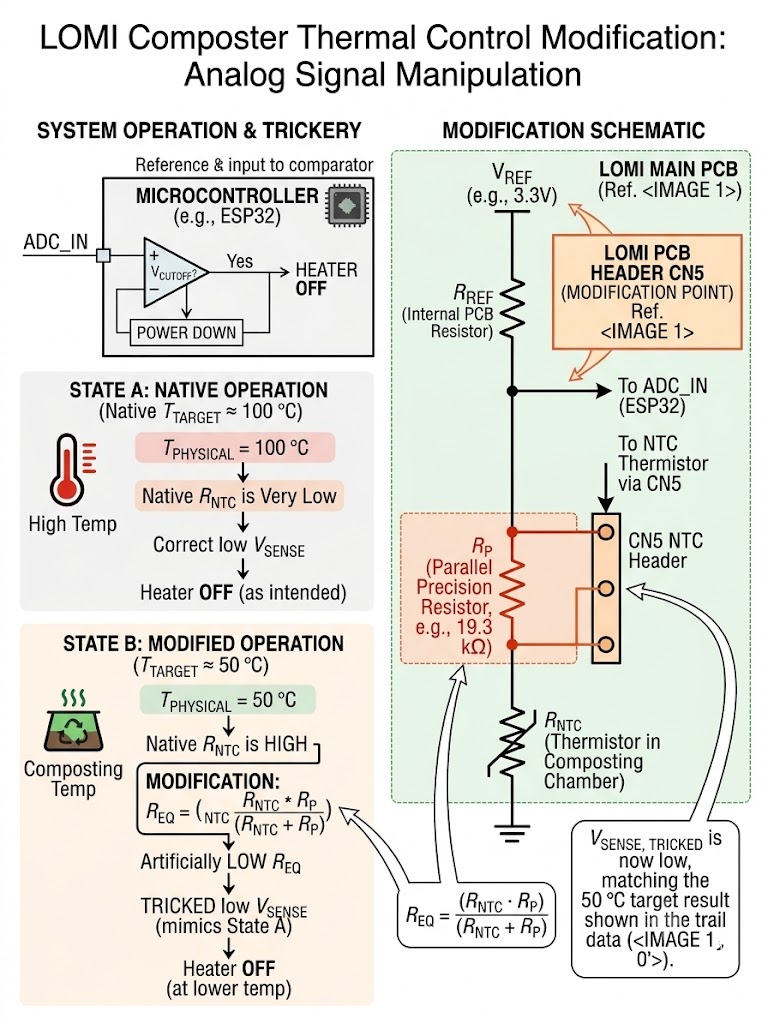
Reverse-engineered a commercial LOMI composter to drop its operating temperature from ~100 °C to a biologically useful ~50 °C — not by touching the firmware, but by soldering a precision parallel resistor across the NTC thermistor (CN5) to bias the analog feedback loop. Characterized empirically with a DS1922T iButton; a 19.3 kΩ resistor settled at ~49.6 °C.
Hardware & Architecture
- Commercial LOMI main control board using an NTC thermistor to regulate the heating element.
- Precision resistor soldered in parallel across the NTC terminals (connector CN5) to lower the equivalent resistance seen by the ADC.
- DS1922T iButton data logger placed inside the chamber for independent thermal profiling.
Key Highlights
- Parallel resistance R_eq = (R_NTC · R_p) / (R_NTC + R_p) prematurely reaches the controller's cutoff threshold, capping physical heat output.
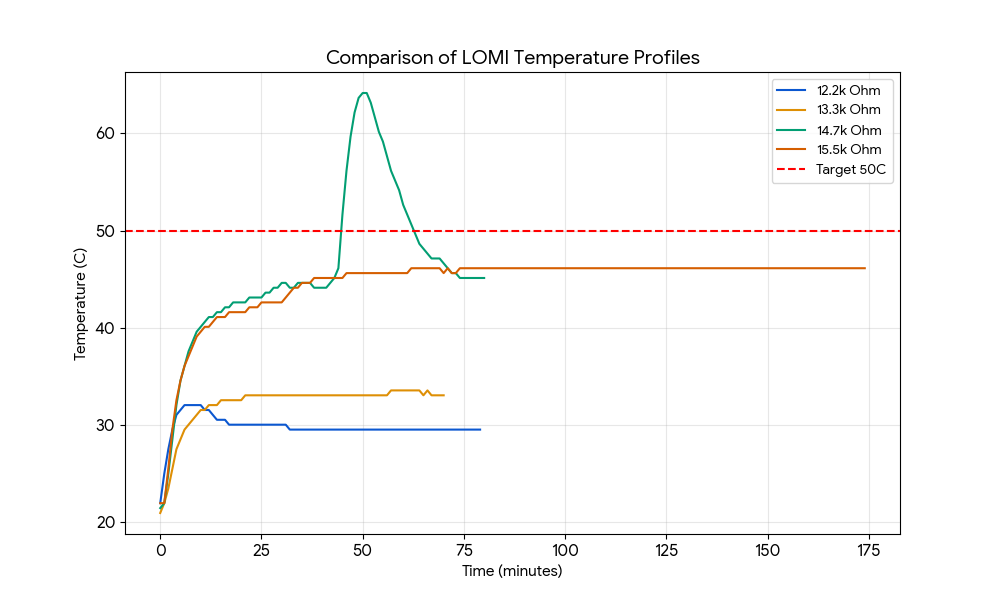
- Swept 12.2–19.3 kΩ: 12.2 kΩ → ~30 °C, 14.7 kΩ underdamped (overshoot past 60 °C), 15.5 kΩ → ~46 °C, 19.3 kΩ → stable ~49.6 °C.
- Python parses DS1922T CSV exports and plots comparative thermal profiles against the 50 °C target.
Images

Code
lomi_thermal_profiles.pyiButton Parsing & Thermal Visualizationpython
import pandas as pd
import matplotlib.pyplot as plt
import glob
import os

# --- Configuration ---
# Directory containing iButton CSV exports
DATA_DIR = "./lomi_thermal_logs/"
TARGET_TEMP_C = 50.0


def load_and_clean_ibutton_data(filepath):
    """
    Parses a DS1922T iButton CSV file.
    Assumes standard iButton format: 'Date/Time' and 'Value' (Temperature).
    """
    try:
        # Skip metadata rows typically found in iButton exports
        df = pd.read_csv(filepath, skiprows=14, usecols=["Date/Time", "Value"])
        df.rename(columns={"Date/Time": "Timestamp", "Value": "Temperature_C"}, inplace=True)
        # Convert timestamp to datetime and calculate elapsed minutes for normalization
        df['Timestamp'] = pd.to_datetime(df['Timestamp'])
        start_time = df['Timestamp'].iloc[0]
        df['Elapsed_Minutes'] = (df['Timestamp'] - start_time).dt.total_seconds() / 60.0
        return df
    except Exception as e:
        print(f"[ERROR] Failed to process {filepath}: {e}")
        return None


def plot_thermal_profiles():
    """Generates a comparative plot of all tested resistor configurations."""
    plt.figure(figsize=(12, 7))
    # Define the configurations to plot and their corresponding colors
    # (Matches the visual output from lomitrail.png)
    configs = {
        "12.2k Ohm": {"file": "LOMI_12.2K.csv", "color": "#1f77b4"},
        "13.3k Ohm": {"file": "LOMI_13.3K.csv", "color": "#f2a900"},
        "14.7k Ohm": {"file": "LOMI_14.7K.csv", "color": "#009e73"},
        "15.5k Ohm": {"file": "LOMI_15.5K.csv", "color": "#d55e00"},
        "16.9k Ohm": {"file": "LOMI(16.9K)_021726.csv", "color": "#8c564b"},
    }

    for label, meta in configs.items():
        filepath = os.path.join(DATA_DIR, meta["file"])
        if os.path.exists(filepath):
            df = load_and_clean_ibutton_data(filepath)
            if df is not None:
                plt.plot(df['Elapsed_Minutes'], df['Temperature_C'],
                         label=label, color=meta["color"], linewidth=2)
        else:
            print(f"[WARNING] File not found: {filepath}")

    # Plot Target Line
    plt.axhline(y=TARGET_TEMP_C, color='r', linestyle='--', linewidth=2, label=f'Target {TARGET_TEMP_C}C')

    # Formatting
    plt.title("Comparison of LOMI Temperature Profiles via NTC Manipulation", fontsize=14, fontweight='bold')
    plt.xlabel("Time (minutes)", fontsize=12)
    plt.ylabel("Internal Temperature (C)", fontsize=12)
    plt.grid(True, linestyle='--', alpha=0.6)
    plt.legend(loc="upper right", fontsize=10)
    plt.tight_layout()
    # Save output for engineering documentation
    plt.savefig("LOMI_Thermal_Characterization.png", dpi=300)
    print("[SYSTEM] Thermal characterization plot saved successfully.")
    plt.show()


if __name__ == "__main__":
    plot_thermal_profiles()