ISCInstrumentation & Signal Conditioning
Portable OD600 Instrument for Microbial Growth Analysis
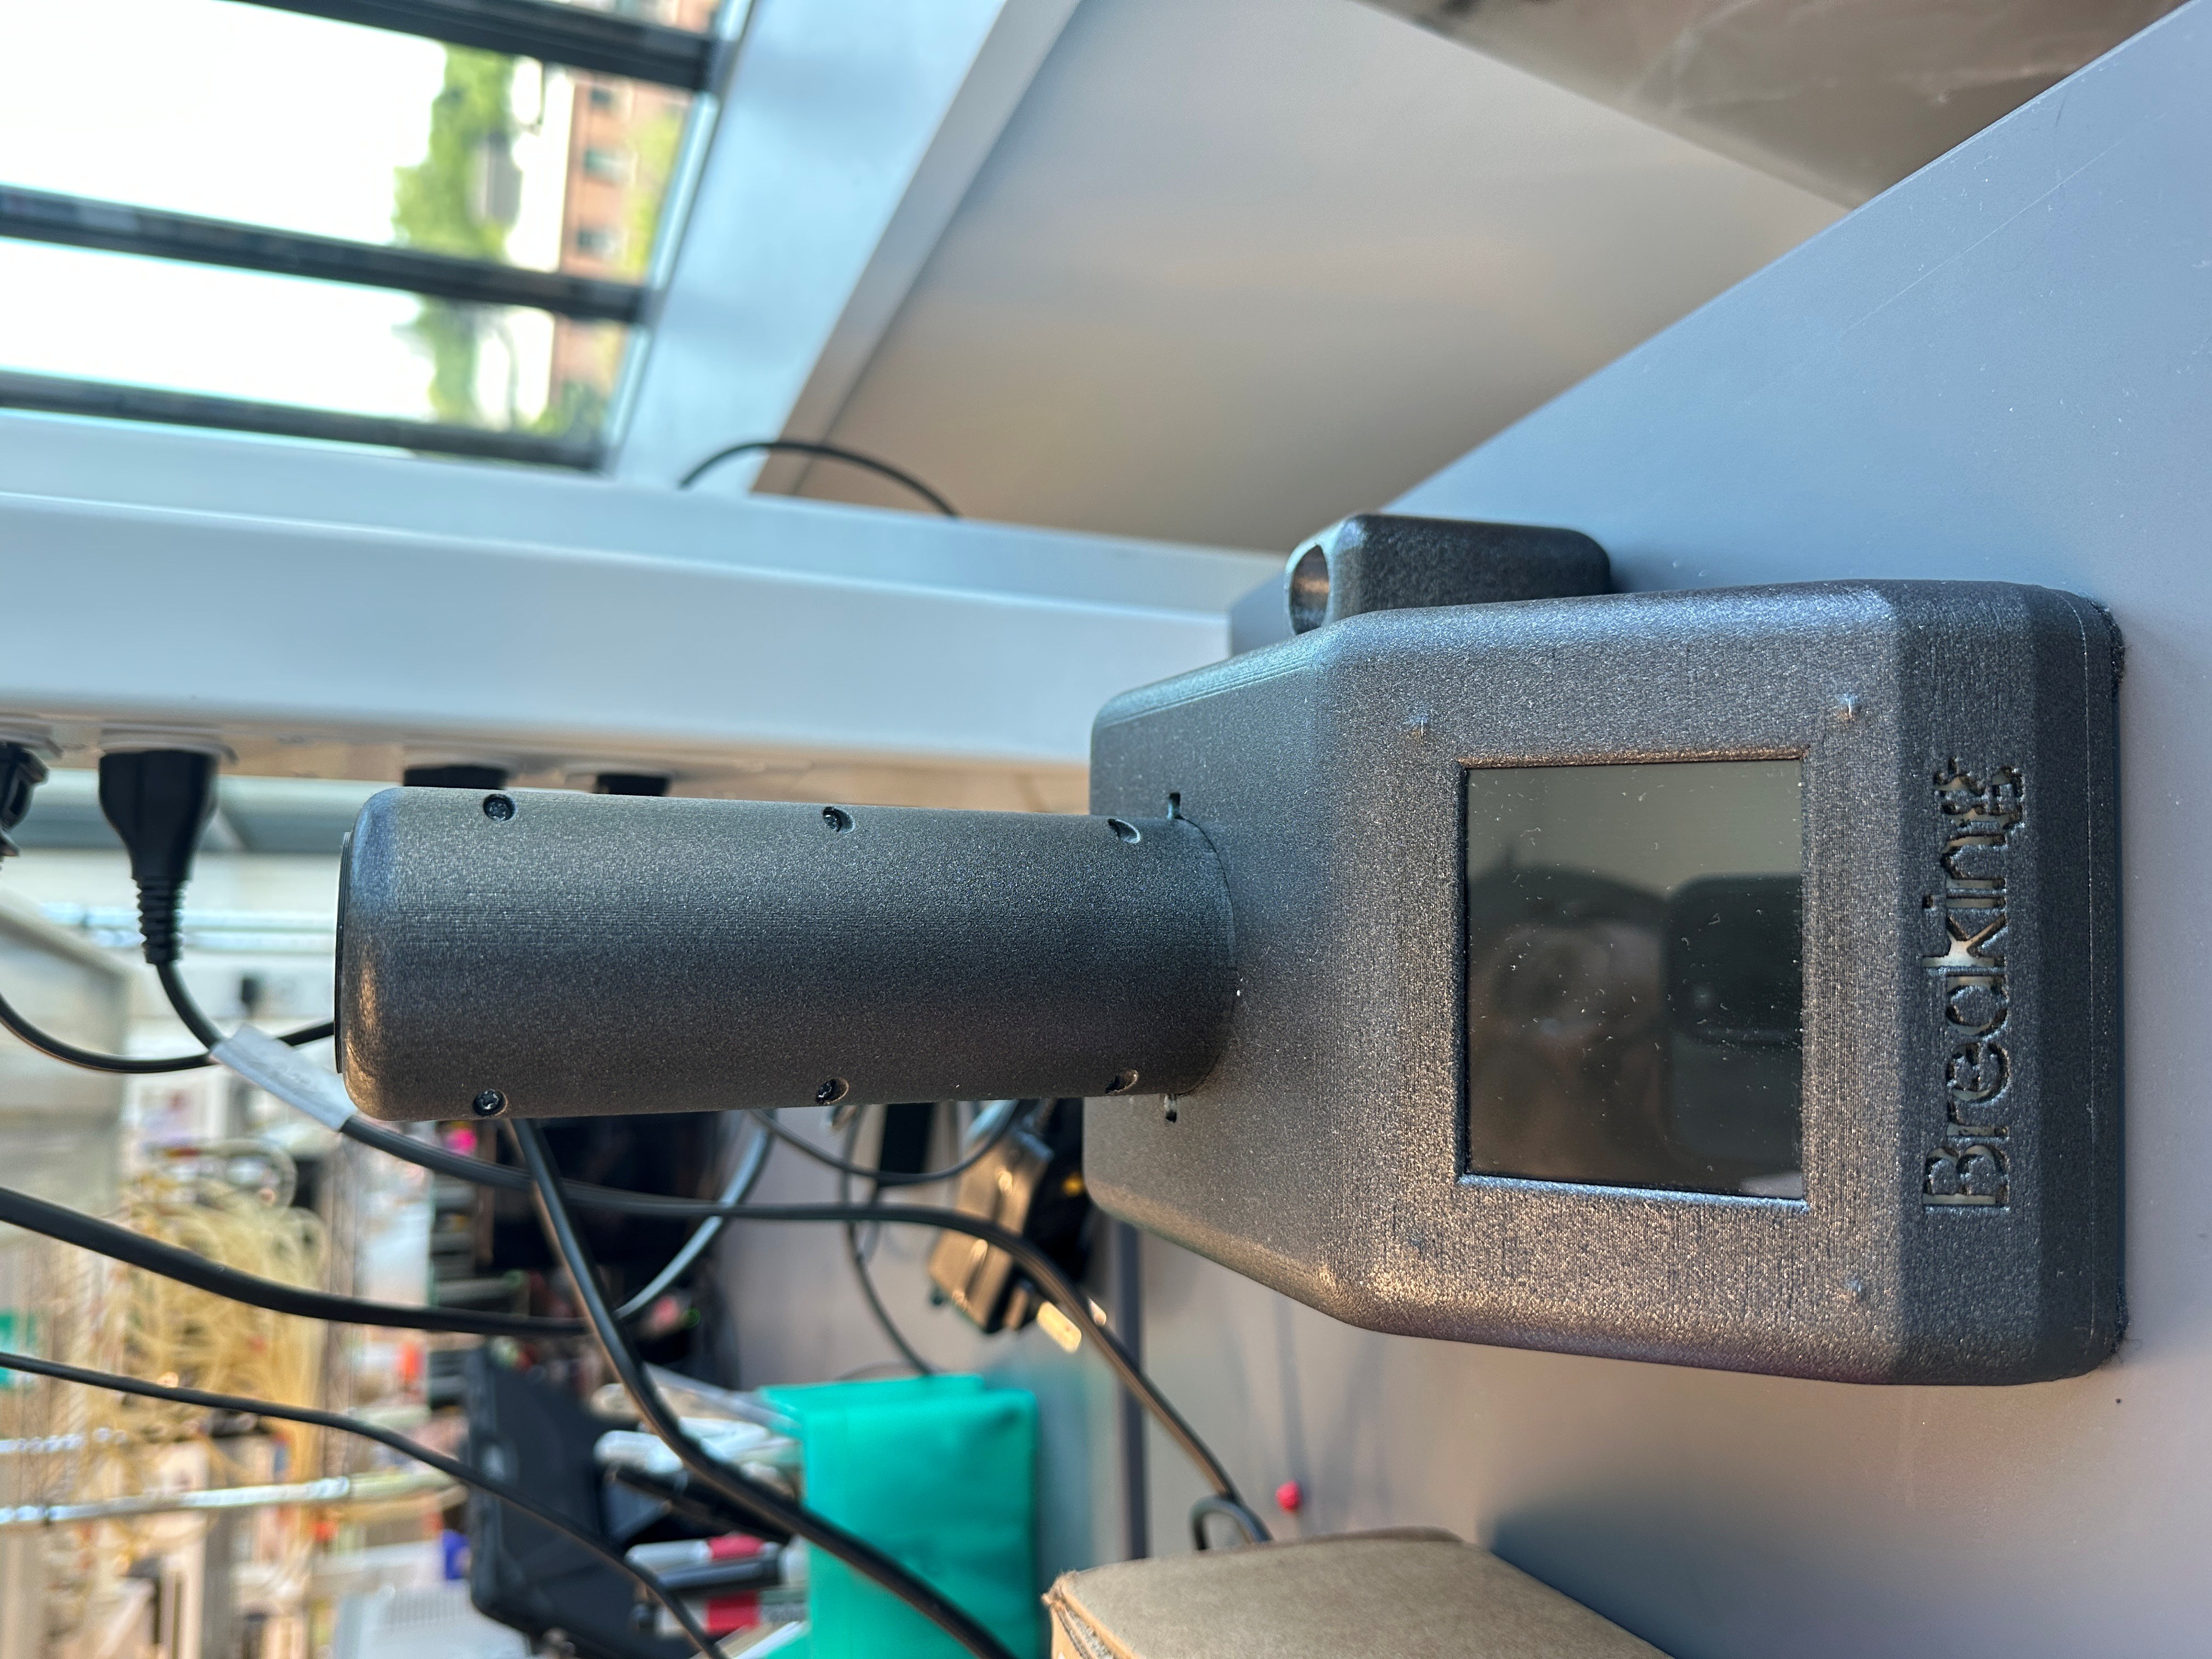
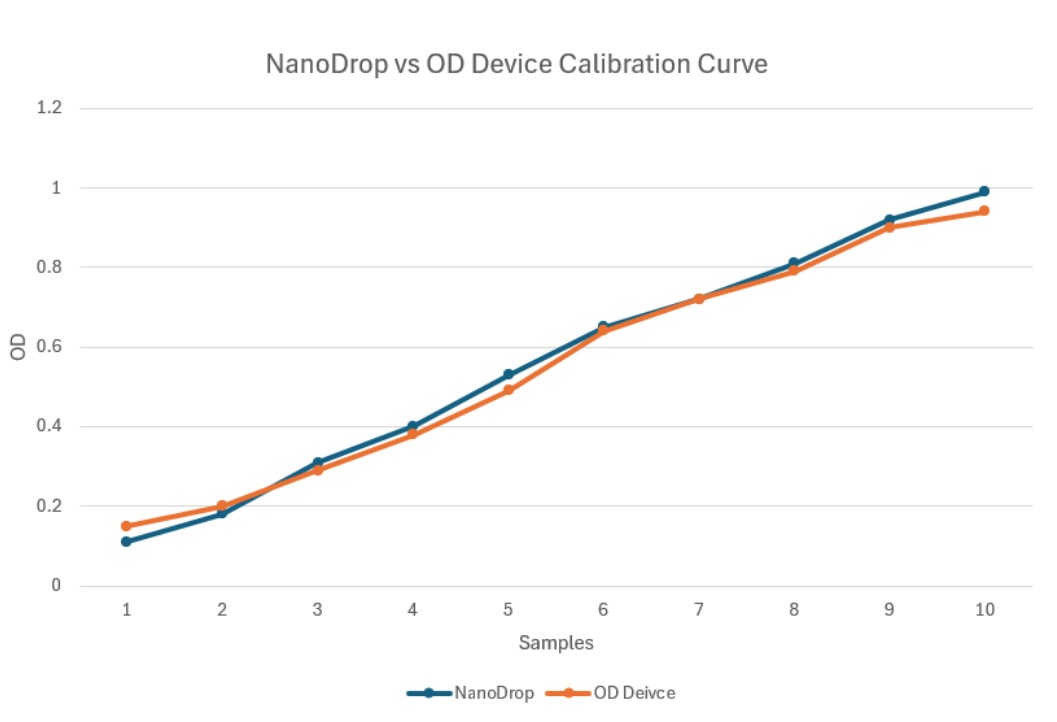
A portable, low-cost spectrophotometer measuring OD600 directly in 19 mm culture tubes. Built across two iterations — from a prototype validating the optical path (analog photodiodes vs. a TSL2591 digital sensor) to a standalone smart device (Arduino Nano 33 IoT, capacitive TFT UI, light-baffled 3D-printed chassis). Beer-Lambert + a 4-Parameter Logistic regression map raw absorbance to a SpectraMax benchmark.
Hardware & Architecture
- Narrow-band 600 nm LED source directed at a TSL2591 high-sensitivity digital light sensor over I²C.
- Arduino Nano 33 IoT running the state machine, driving a capacitive TFT touchscreen for guided dark/blank calibration.
- SolidWorks/Fusion 360 chassis with internal baffling and tight-tolerance tube holders aligning LED and sensor along the tube's diametric axis.
- Iteration 1 (Arduino Micro, 16x2 LCD) established the optical path; Iteration 2 refined it into a standalone smart device.
Key Highlights
- Beer-Lambert absorbance from dark/blank/sample intensities acquired on-device.
- Python 4-Parameter Logistic (4PL) regression corrects for non-linear light scattering at high cell densities, mapping raw absorbance to SpectraMax ground truth.
- Fitted A/B/C/D constants are hardcoded back into firmware for real-time lab-grade OD600.
Images
Code
od600_measurement.inoNano 33 IoT Measurement Logiccpp
#include <Wire.h>
#include <Adafruit_Sensor.h>
#include <Adafruit_TSL2591.h>
#include <math.h>

Adafruit_TSL2591 tsl = Adafruit_TSL2591(2591);

// Calibration variables stored in RAM/EEPROM
float darkIntensity = 0.0;
float blankIntensity = 0.0;

void setup() {
  Serial.begin(115200);
  if (!tsl.begin()) {
    Serial.println("Error: TSL2591 not detected.");
    while (1);
  }
  // Configure for high sensitivity measuring low-transmission liquids
  tsl.setGain(TSL2591_GAIN_MED);
  tsl.setTiming(TSL2591_INTEGRATIONTIME_300MS);
}

// Function triggered via TFT UI during "Dark Calibration"
void calibrateDark() {
  // LED OFF, read ambient/stray light
  darkIntensity = readSensorAverage(10);
  Serial.print("Dark Intensity Set: ");
  Serial.println(darkIntensity);
}

// Function triggered via TFT UI during "Blank Calibration"
void calibrateBlank() {
  // LED ON with sterile media in the tube
  blankIntensity = readSensorAverage(10) - darkIntensity;
  Serial.print("Blank Intensity Set: ");
  Serial.println(blankIntensity);
}

// Real-time measurement routine
float measureRawAbsorbance() {
  float sampleIntensity = readSensorAverage(5) - darkIntensity;
  if (sampleIntensity <= 0 || blankIntensity <= 0) return 0.0;
  // Beer-Lambert Law Calculation
  float transmission = sampleIntensity / blankIntensity;
  float rawAbsorbance = log10(1.0 / transmission);
  return rawAbsorbance;
}

float readSensorAverage(int samples) {
  float sum = 0;
  for (int i = 0; i < samples; i++) {
    uint32_t lum = tsl.getFullLuminosity();
    uint16_t visible = lum & 0xFFFF; // Extract visible spectrum
    sum += visible;
    delay(50);
  }
  return sum / samples;
}od600_4pl_calibration.py4PL Calibrationpython
import numpy as np
import matplotlib.pyplot as plt
from scipy.optimize import curve_fit

# Raw Absorbance from Arduino (Independent Variable)
x_raw_abs = np.array([0.05, 0.12, 0.28, 0.55, 0.85, 1.2, 1.6])
# Ground Truth OD600 from SpectraMax (Dependent Variable)
y_true_od = np.array([0.1, 0.25, 0.6, 1.2, 2.0, 3.2, 4.5])


# 4-Parameter Logistic (4PL) Function
# A: Minimum asymptote, B: Hill's slope, C: Inflection point, D: Maximum asymptote
def four_param_logistic(x, A, B, C, D):
    return D + (A - D) / (1.0 + (x / C) ** B)


# Initial guess for the parameters [A, B, C, D]
initial_guess = [0.0, 1.5, 0.8, 6.0]

# Perform non-linear curve fitting
popt, pcov = curve_fit(four_param_logistic, x_raw_abs, y_true_od, p0=initial_guess)
A, B, C, D = popt
print(f"[CALIBRATION CONSTANTS] A: {A:.4f}, B: {B:.4f}, C: {C:.4f}, D: {D:.4f}")

# Visualization of the Calibration Curve
x_fit = np.linspace(0, 2.0, 100)
y_fit = four_param_logistic(x_fit, *popt)
plt.figure(figsize=(8, 6))
plt.scatter(x_raw_abs, y_true_od, color='red', label='Empirical Data Pairs', zorder=5)
plt.plot(x_fit, y_fit, color='blue', linestyle='--', label='4PL Regression Fit')
plt.title('Portable Instrument Calibration: Raw Absorbance vs. SpectraMax OD600')
plt.xlabel('Arduino Raw Absorbance (A)')
plt.ylabel('True OD600 (SpectraMax)')
plt.grid(True, alpha=0.5)
plt.legend()
plt.show()
# Note: The resulting A, B, C, D constants are then hardcoded into the Arduino firmware
# to convert measureRawAbsorbance() into accurate lab-grade OD600 in real-time.